IMD (Indices of Multiple Deprivation) statistics are produced at the LSOA (Lower Super Output Area) level. Sheffield has 345 LSOAs and 28 wards.
To produce ward level summary measures for Sheffield from 2019 IMD we’ve followed the methodology set out in the ward level summaries document on the London Datastore Indices of Deprivation web page (which in turn is derived from the ONS Local Authority level IMD summaries):
“The Average of LSOA Scores measure describes the ward as a whole and is a population weighted average for the ward. This is calculated by first multiplying the IMD score for each LSOA by the population estimate for that LSOA. Where an LSOA is split between wards, a proportion of the population equivalent to the proportion of the LSOA’s addresses falling within that ward is multiplied by the IMD score for that LSOA. These figures are then summed across all LSOAs and part LSOAs within the ward and the result is divided by the total population for that ward (the sum of the LSOA population estimates). This measure takes into account the full range of scores within the ward and the number of people affected by the level of deprivation in each LSOA.”
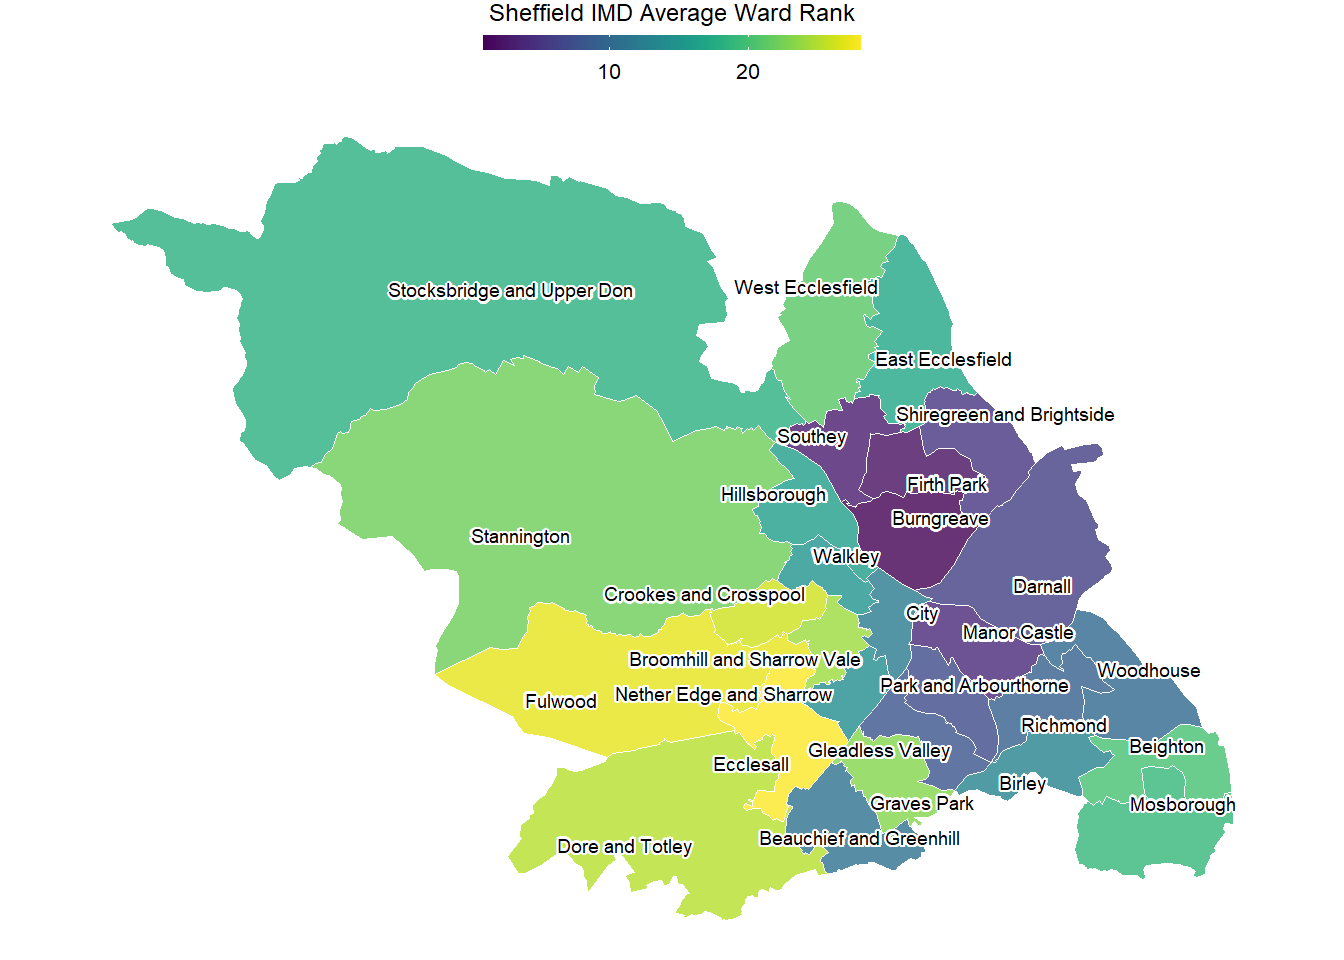
“The Average of LSOA Ranks measure again takes into account the full range of deprivation across each ward but using the ranks of LSOAs rather than the scores.”